Understanding Attitudes Towards Mathematics (ATM) using a Multi-modal model: An Exploratory Case Study with Secondary School Children in England
¶ 1 Leave a comment on paragraph 1 2 Abstract
¶ 2 Leave a comment on paragraph 2 1 This paper reports on a multi-modal exploratory case study within the realm of pragmatism to study the attitudes of 11 and 15 year old students regarding Mathematics. More than 200 secondary school children from the East Midlands, England, participated in this research. The aim of this research was to understand students’ emotions, perceptions, beliefs and vision about Mathematics and to investigate the factors which influence their attitudes. This study employed a multi-modal research design to elicit data from the young learners by engaging and involving them through different media of communication. Four different kinds of data were collected namely aural or spoken data (audio recorded in focus group interviews), scale data (from Likert scale style items in the questionnaire) textual/written data (collected through open ended questions in the questionnaire), and visual data (in the form of pictures drawn by the participants). Since the favoured mode of expression varies from person to person, multiple modes of data collection can include a larger number of respondents by providing them the opportunity to orchestrate their perspective in their preferred mode of communication. This research suggests that gender and attainment level have a significant impact on attitudes towards Mathematics. Boys and high ability learners have a more positive attitude towards the subject as compared to girls and low ability students. Socio economic status and linguistic background also seem to influence ATM but the effect is statistically insignificant.
¶ 3 Leave a comment on paragraph 3 0 Keywords: attitude, affect, cognition, gender, attainment
¶ 4 Leave a comment on paragraph 4 0 Introduction
¶ 5 Leave a comment on paragraph 5 0 Mathematics is taught as a core subject in school curricula all over the world because mathematical knowledge and skill is considered to be an essential tool not only for the economy to thrive but also for the society to flourish. However, students’ aversion to Maths (National Numeracy, 2012) and deteriorating performance of young people in Maths at secondary level estimated through international standardised tests like PISA and TIMSS has become a cause of concern for teachers, educators and policy makers in the UK and other countries (OEDC, 2013). The purpose of this research was to get an insight into students’ perceptions and to understand their attitudes towards Maths. The participants of this study were 11 and 15 year old secondary school children from a major city in the East Midlands, England, which is well known for its cultural and ethnic diversity. This study compared the attitudes towards Mathematics of children belonging to different age, gender, linguistic background, socio economic status and attainment level at school. This research also explored the role of teachers in shaping learners’ attitudes towards Mathematics. This paper, however, will focus on the multi modal methodology of this research and will discuss the impact of age, gender, socio-economic status, linguistic background and attainment level on ‘affect’ and ‘cognition’ components of ATM using quantitative as well as qualitative data.
¶ 6 Leave a comment on paragraph 6 3 This paper is presented in three main sections: the first part includes the introduction, the theoretical framework of the research and a brief review of relevant literature. The second section describes the multi-modal research design for this study and the final section reports on the findings of this study followed by discussion.
¶ 7 Leave a comment on paragraph 7 0 1.1 Theoretical Framework for this Research
¶ 8 Leave a comment on paragraph 8 2 Attitude is defined as “a settled way of thinking or feeling about something” (Oxford Dictionary, 2016). It is also referred to as the “sum total of a man’s inclinations and feelings, prejudice or bias, preconceived notions, ideas, fears, threats, and convictions about any specific topic” (Thurstone, 1928, p. 532). Attitudes are an integral component of human character, comprising of the proclivities and predispositions that guide an individuals’ behaviour (Rubinstein, 1986). Attitudes can change and develop with time (Rubinstein, 1986) and can be evaluated as positive or negative (Fishbein & Ajzen, 1975). Attitudes are not overtly visible but can be inferred from observable and evaluative responses expressed as approval or disapproval, approach or avoidance and attraction or repulsion (Eagly & Chaiken, 1998).
¶ 9 Leave a comment on paragraph 9 0
¶ 10
Leave a comment on paragraph 10 0
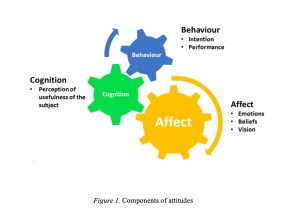
¶ 11 Leave a comment on paragraph 11 2 The construct “attitude” has been defined in a host of different ways such as uni-dimensional, bi-dimensional, multi-dimensional, making the term vague. For this research, a framework for ATM has been developed in the light of the different definitions. It is based on the multidimensional model taking affect, cognition and conative or behaviour aspects into account (as shown in Figure 1). Affect, for this research is supposed to encompass emotions, beliefs and vision of the subject. Emotions can be described as the feelings of enjoyment or pleasure in learning the subject or conversely finding it boring and dull. Beliefs are self-concepts of pupils as mathematical learners and their confidence in their mathematical abilities (Bandura, 1994, 1997) whereas vision is their perception about the subject. Cognitive component represents students’ perceived usefulness of the subject in everyday life at present and its applicability for future life and career (Adelson & McCouch, 2011). Conative or behaviour component in itself is multi-faceted and therefore difficult to describe. It can pertain to learners’ actions, commitment and performance in the class. The components of attitude are not mutually exclusive; they intersect and overlap and form clusters (Neuman, 2005). They have common attributes and they influence each other.
¶ 12 Leave a comment on paragraph 12 1 1.2 Factors influencing ATM
¶ 13 Leave a comment on paragraph 13 1 There are a multitude of personal, instructional and environmental factors that may influence ATM, but for this paper we will take into account the following five factors namely achievement, gender, age, socio economic status and linguistic background.
¶ 14 Leave a comment on paragraph 14 0 1.2.1 Achievement.
¶ 15 Leave a comment on paragraph 15 3 Research suggests a positive relationship between academic attainment and attitude towards Maths (Bramlett & Herron, 2009; Nicolaidou & Philippou, 2003; Papanastasiou, 2000; Ma & Kishor, 1997). Children’s attitude towards Maths (ATM) develops over time and may affect their self-concept and behaviour in class. It is believed that students who enjoy Mathematics and have high self-concepts and self-esteem about their mathematical abilities pay more attention, participate actively in class and are more involved in the learning process. They are also more likely to persistently try hard without losing interest while confronting a challenge (e.g., Bandura, 1977, 1986, 1997; Meyer et al., 1997; Pajares & Miller, 1994; Pintrich & Zusho, 2002; Stipek, 2002). A negative attitude towards the subject can impede learners’ progress and affect their self-confidence and morale. Students’ enjoyment (affect) while learning and their perceived usefulness of Mathematics (cognition) can influence their behaviour or conative aspect of attitude. Learners having positive emotions towards Maths show a higher level of commitment and increased capacity of exerting efforts which result in better achievement (Stipek, 2002). A case study conducted by Renninger and Hidi (2002) maintains that “a student with a well-developed interest for subject matter might be expected to have high achievement whereas a student with a less well-developed interest is less likely to experience high achievement” (p. 187). The IEA’s Third International Mathematics and Science Study (TIMSS, 2011) also found widespread positive correlation between liking mathematics and mathematics achievement.
¶ 16 Leave a comment on paragraph 16 0 Achievement in Mathematics is also related to the rational thoughts (cognitive domain) of the learners and according to TIMSS (2011) 85 per cent 14 – 15 year old students internationally (belonging to 63 different countries) believe that maths is useful in their daily lives and in securing a good job in the future. The students who valued maths had the highest average achievement, followed by the ones who somewhat valued the subject. The students who did not consider Maths to be important (15% of the sample) were among the lowest achievers. This suggests that understanding the significance of the subject can motivate the students to strive harder and improve their learning (grades). Students’ perceived value for Maths can influence their attitude towards the subject. If they understand the significance and application of Maths in their lives, they are inspired to study, practice and learn it (Pajares & Miller, 1994). There are many students who do not particularly enjoy mathematics and report a disliking for the subject (negative affect), nevertheless they still respect the utility and importance of Maths is their future lives and careers (Klinger, 2004). Another research also reports a strong relationship between participation/ achievement in Maths and learners’ perception of the usefulness of the subject, both at present and in the future (Meyer & Koehler, 1990).
¶ 17 Leave a comment on paragraph 17 0 1.2.2 Gender and Age.
¶ 18 Leave a comment on paragraph 18 0 Another notable factor regarding ATM is gender. Maths is perceived to be a masculine and male dominated field (Ernest, 2004). Girls demonstrate lack of confidence in their mathematical abilities and feel reluctant to participate in class activities as compared to boys. In most countries, girls on average underperform as compared to boys in similar age groups and this gap in performance is wider among the highest achieving students (PISA, 2012). The same trends can be seen in UK as well. Boys exhibit a high level of self-concept regarding their mathematical abilities and consider themselves more able than girls (Ireson et al., 2001). Girls, on the other hand, have high levels of anxiety and significantly lower level of confidence in comparison to boys (Rogers, 2003). ATM also seems to be related to age. Research on primary school children suggests that ATM deteriorates with age (Dowker, Bennet & Smith, 2012) and by the age of nine children have made up their minds whether they like or dislike Maths (Bloom, 2008).
¶ 19 Leave a comment on paragraph 19 0 1.2.3 Socio Economic Status and Linguistic Background
¶ 20 Leave a comment on paragraph 20 0 The impact of socio economic status on students’ performance (not on attitude to Maths) was examined by PISA (2012) and mixed trends were found. Pupils in some of the highest achieving countries in Maths come from socio economically deprived backgrounds; but their family status does not seem to obstruct their performance in the subject. In the UK, however, allowing for some variations in the different regions, socio economic status of a family can have a 10 to 20% impact on the academic achievement of 15 year old learners in Maths (National Numeracy, 2012). Children from economically disadvantaged families (measured on the basis of their eligibility for a free school meal) have a much smaller chance of achieving a good grade in Maths in the GCSE (General Certificate of Secondary Education) exam (Warren & Paxton, 2013) as compared to the children who do not receive free school meals. However, the relation, (if any) between socio economic background and ATM has not been established.
¶ 21 Leave a comment on paragraph 21 0 Similarly the effect of linguistic background on ATM has not been explored. This research was based in a multicultural city where a sizeable proportion of the population belongs to ethnic minorities. This provided an opportunity to draw diversified samples and to compare the ATM of bi/multilingual children with those who speak English only.
¶ 22 Leave a comment on paragraph 22 1 Research Design
¶ 23 Leave a comment on paragraph 23 0 This research is a comparative case study within the realm of pragmatism designed to investigate “a set of multiple case studies of multiple research entities for the purpose of cross unit examination” (Berg, 2009, p.328). Thus participants of this research are compared in terms of age, attainment, gender and ethnic and socio-economic back ground to look for similarities and differences. This study adopts a mixed-method exploratory sequential approach and both qualitative and quantitative data collecting instruments are employed to address the research questions. The purpose of employing mixed method strategy is to gather complex and comprehensive information to better investigate and understand the case. Use of mixed methods also improves the reliability and authenticity of the research due to triangulation.
¶ 24 Leave a comment on paragraph 24 0 2.1 Sampling
¶ 25 Leave a comment on paragraph 25 0 Selecting the research participants to give representation to all different sub groups was a crucial aspect of this research. Thus an intricate multi-layered purposive sampling technique was used. The aim of purposive sampling is to study specific characteristics of interest in a population (Cohen, Manion & Morrison, 2007) and to explore the intricacies of the issue in a quick and simple manner. The purposive sampling strategy was employed to pick:
- ¶ 26 Leave a comment on paragraph 26 0
- Schools on the basis of FSM (free school meals), ESL (English as a second language) and average attainment in KS4 (Key Stage 4).
- Year and ability cohorts within schools to represent students from different age groups (pupils from year 7 & year 10) and attainment levels (high ability cohort and low ability cohort).
- Students from each age and ability group to represent both the genders.
¶ 27 Leave a comment on paragraph 27 0 2.1.1 Sampling Frame
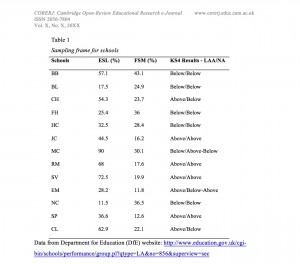
¶ 28 Leave a comment on paragraph 28 2 There are 38 secondary schools in the city listed on the Department for Education website (DfE, 2014). The target population of this research was boys and girls of year 7 (beginning of KS3) and year 10 (beginning of KS4) between the age cohort 11 – 15 years. Thus to keep the sample fairly similar and practical all the middle schools (for 11 – 14 year old students only), high schools (for 14 – 18 year old students only), single sex schools, independent schools and special schools were eliminated. The remaining 13 schools and the percentage of their pupils speaking English as a second language, pupils eligible for free school meals and the KS4 results are shown in Table 1.
¶ 29 Leave a comment on paragraph 29 0
¶ 30 Leave a comment on paragraph 30 0
¶ 31
Leave a comment on paragraph 31 0
¶ 32 Leave a comment on paragraph 32 0
¶ 33 Leave a comment on paragraph 33 0
¶ 34 Leave a comment on paragraph 34 0 Data from Department for Education (DfE) website: http://www.education.gov.uk/cgi-bin/schools/performance/group.pl?qtype=LA&no=856&superview=sec
- ¶ 35 Leave a comment on paragraph 35 0
- FSM data provides the percentage of students eligible for a free school meal and is commonly used as an indicator of socio economic status of a family.
- ESL data shows the percentage of students speaking English as a second language.
- Average attainment in KS4 gives data on pupils attaining 5 A* – C in GCSE for the last 4 years in comparison to LAA (local authority average) and NA (national average).
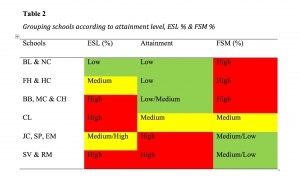
¶ 36 Leave a comment on paragraph 36 0 These schools were then grouped according to their FSM and ESL percentages and attainment level (Table 2). The red colour in the ESL and FSM columns indicates that a high band of students in the school speak English as a second language and are eligible for free school meals (40% and above), yellow indicates a medium band (20% to 39% students) and green indicates a low band (below 20% students). In the attainment column red colour shows a high attainment level (mostly above LAA and NA), yellow shows a medium attainment level (above/below) and green shows a low attainment level (mostly below LAA and NA).
¶ 37 Leave a comment on paragraph 37 0
¶ 38 Leave a comment on paragraph 38 0
¶ 39
Leave a comment on paragraph 39 0
¶ 40 Leave a comment on paragraph 40 0
¶ 41 Leave a comment on paragraph 41 0
¶ 42 Leave a comment on paragraph 42 0 A quick look at the table shows a negative correlation between academic attainment and free schools meals. Schools with high ratio of pupils eligible for free school meals typically perform below the local authority average /national average in the GCSE exam. On the contrary, schools with high achievement in GCSE have low FSM ratio. This data suggests that academic attainment is related to socio economic background of the student. ESL ratio displays mixed trends and does not seem to be related to either FSM or school attainment.
¶ 43 Leave a comment on paragraph 43 0 2.1.2 Sample Selection.
¶ 44 Leave a comment on paragraph 44 0 A sample is “a small group of research participants or a subset from which a degree of generalization can be made” (Carey, 2011, p. 41). The sample for a research study has to be selected keeping in mind the time and resource constraints. For this project, it was planned to include three schools in the main study (and one in pilot study) in such a way that one school from each of the sub groups [low ESL, low attainment and high FSM group (top rows in the table), medium/high ESL, high attainment and medium/low FSM group (bottom rows) and high ESL, medium attainment and medium FSM (middle row)] could get representation. All the 13 schools were contacted one by one; however only two schools agreed to allow access to their students. These schools will now onwards be referred to as Cedar School [from the high ESL, medium attainment, medium FSM group (middle row in the table)] and Juniper School from the medium/high ESL, high attainment and medium/low FSM group (bottom row)]. Thus the perspective of the students from schools with low ESL, low attainment and high FSM could not be included in the research as no school from this group agreed to participate in the research study due to their other commitments. Within schools, individual students were handpicked by the Maths teachers/head of the department according to the selection criterion (mentioned in the sampling section) already negotiated with them.
¶ 45 Leave a comment on paragraph 45 0 2.2 Research instruments
¶ 46 Leave a comment on paragraph 46 0 For this study two types of research instruments were used.
- ¶ 47 Leave a comment on paragraph 47 0
- Focus Groups Interviews – to collect aural or spoken data which was audio recorded (n=4×4=16).
- Questionnaires (n=187) to gather:
- ¶ 48 Leave a comment on paragraph 48 0
- Scale data – from Likert scale style items
- Textual or written data – through open ended questions
- Visual data – in the form of pictures drawn by the participants
¶ 49 Leave a comment on paragraph 49 0 2.2.1 Focus Groups
¶ 50 Leave a comment on paragraph 50 0 Focus groups are small scale group discussions addressing a particular topic of interest or relevance to the group and the researcher with the aim to draw information about the “conscious, semi-conscious and unconscious psychological and socio cultural characteristics and processes” (Berg, 2009, p. 158). For this research, focus groups were considered to be the most suitable data collection tool for qualitative data because of a number of reasons. This was an exploratory mixed method sequential research and the data collected in focus groups, besides being used in its own worth, was used as a stimulus to develop questionnaire for the second part of the research. Focus groups are lively interview style discussions held in an informal atmosphere which encourages the respondents to speak openly and freely about attitudes, opinions and behaviours. These discussions allow the participants to explore and clarify their views, taking the research in new and sometimes unexpected directions (Kitzinger, 1995) and bringing to the fore issues that are important for them.
¶ 51 Leave a comment on paragraph 51 0 Focus group interview is an efficient technique of data collection as compared to individual interviews because more people can be included in a single session saving time and resources. Focus group interviews seek to generate qualitative data “by capitalising on the interaction that occurs within the group setting” (Sim & Snell, 1996, p. 189). The interviewees get the opportunity to hear other people’s views which can stimulate their thinking and help them rethink and develop their opinion. Group discussion is also an effective quality control measure as the group members can challenge and curb extreme or false views and provide check and balance on each other (Patton, 2002).
¶ 52 Leave a comment on paragraph 52 1 The plan for conducting focus groups was discussed with the heads of the departments in the selected schools and dates and times were finalised. The maximum time allowed for each focus group was 30 minutes. In total four focus groups (involving 16 students) were arranged. The size of the focus group was kept small so that each student gets enough time to express his/her opinion. To give equal representation to both gender and ability, the schools were asked to allow one girl and one boy from the higher ability (HA) cohort and another pair from the low ability (LA) cohort to participate in the focus groups. Thus in each school two focus group discussions took place and from each school four pupils from year 7 and four pupils from year 10 participated. The focus groups were conducted within the school premises in a vacant classroom so the environment was familiar and comfortable for the students. The participants of the focus group were homogeneous in the sense that they belonged to the same age and year group. However, they were from different ability groups, gender and ethnic/linguistic backgrounds which could provide dissonance and add richness to the data. It’s natural for group members to possess varying level of confidence, expression and vigour but the moderator needs to ensure that the ‘thought leaders’ (Henderson, 1995) do not dominate the proceedings and the ‘less articulate voices’ do not get suppressed. Nevertheless, the tendency of some weaker participants to acquiesce to the opinion of the more assertive ones remains. Asking the respondents to write down their thoughts beforehand can encourage them to disclose their views (Carey, 2001). For the same purpose, before the start of the focus group discussion a few written questions related to the topic were given to the participants individually to read through and note down their responses. These questions were also used as a starting point for discussion and as a tool to stimulate their thinking. Generally, the focus groups went well and helped in collecting useful qualitative data. Keeping in mind the fact that the total contact time allowed with the children was only 25 – 30 minutes for each focus group, after transcribing the proceedings of the focus groups which were audio recorded, data equivalent to 1100 – 1400 words was collected from each cohort.
¶ 53 Leave a comment on paragraph 53 0 Despite being an efficient tool of data collection, focus groups have some drawbacks which can be minimized by using a combination of data collecting instruments. Focus groups bring forth a more collective position of the group, where individual stance of each participant is not clearly distinguishable. They disclose the nature and scope of the contributors’ views but do not inform about the strength and intensity of their opinion. Also, it’s problematic to generalise data gathered through focus groups (Henderson, 1995).
¶ 54 Leave a comment on paragraph 54 0 2.2.2 Questionnaire
¶ 55 Leave a comment on paragraph 55 0 The second phase of the research consisted of questionnaires which were designed in consonance with the epistemological framework of the research and the stipulated research questions. The content of the questionnaire was developed after carefully reading available literature on attitudes regarding Maths, questionnaires previously used in research on measuring attitudes (e.g. Fennema-Sherman, 1976) and the data accumulated through focus group discussions. The questionnaire was paper based and was administered in four different cohorts in each school. It was an anonymous questionnaire and collected three kinds of data: Scale, textual and visual data.
¶ 56 Leave a comment on paragraph 56 0 2.2.2.1 Scale data
¶ 57 Leave a comment on paragraph 57 1 Likert scale and its modified forms are widely used as a rating scale to measure attitudes and opinions. Likert scales ascertain attitudes by presenting a list of statements and asking the respondents to rate them. They are ordinal scales used to gauge the likelihood, frequency, importance or opinion about a subject on a five or seven point scale, often ranging from ‘strongly agree’ to ‘strongly disagree’ (Burns & Grove, 1997). For this research, Likert scale was adopted to prepare 12 Likert scale type questions for measuring the attitudes on a three point scale. The number of options on the scale was reduced to make the questionnaire simple to answer for the young participants of the research. Emoticons were also added on the three point scale, with a smiley face signifying agreement, a straight face indicating indecisiveness and a sad face denoting disagreement (Sun, 2009). The purpose was to elaborate the options pictorially for visual learners and to make the questionnaire look appealing. Although a high number of items on the Likert scale improve the reliability of the instrument in assessing attitudes, the number of items was kept low keeping in view the short concentration span of young learners and the limited time allowed to them for answering the questionnaire. Two terms with negative connotation were also included to test the alertness of respondents and to improve the reliability of the results. The questionnaire also included some factual questions to gather demographic data.
¶ 58 Leave a comment on paragraph 58 0 2.2.2.2 Textual and Visual data
¶ 59 Leave a comment on paragraph 59 0 The second part of the questionnaire was open ended and asked the learners to write a paragraph or draw a picture (Smith, 2011) about their perception of Maths and how it impacts their life under the title ‘Maths and Me’ (Adelson & McCoach, 2011; Di Martino & Zan, 2010). The idea was to provide an opportunity to the young learners to express their views about Maths in their own words or illustrations in the absence of peer judgement. Drawing is a much liked activity among children and provides an alternative medium of expression. It is a useful tool to elicit data from children and is considered to be relatively more reliable as compared to ‘‘the deceptive world of words’’ (Collier, 2001, p. 59) quoted in Denscombe, (2010). Nevertheless, drawings are quite difficult to interpret, therefore the participants were asked to label their images.
¶ 60 Leave a comment on paragraph 60 0 Data Analysis and Findings
¶ 61 Leave a comment on paragraph 61 0 Focus group data and textual data from questionnaires were analysed thematically. Quantitative data was analysed statistically using simple descriptive statistics and t-tests with the help of Excel and SPSS. To analyse visual data, a holistic approach was employed taking into account the content as well as the context of the image/drawing within the theoretical framework of the research. Each kind of data was analysed on its own as well as in combination with other forms of data to better understand the subject. Overall the different types of data complemented each other, however there were some variations.
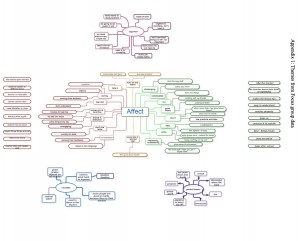
¶ 62 Leave a comment on paragraph 62 1 Aural/spoken data from focus groups was transcribed and major themes were identified (attached as appendix 1). Broadly speaking, students from Juniper School (high attainment, low FSM) were more positive as compared to Cedar School (medium attainment, medium FSM). Participants of two out of four focus groups (one from year 7 and the other from year 10) had mixed opinions about Maths. Of the remaining two groups, Year 10 clearly showed negative affect but mixed cognition while Year 7 were positive for both components of attitudes. Overall pupils in year 7 expressed favourable attitudes and were more approving of the subject whereas pupils in year 10 showed aversion. This seems to indicate that the ‘spoiling’ of attitudes occurs between the age of 11 and 15 at KS3 level.
¶ 63 Leave a comment on paragraph 63 0 3.1 Statistical Analysis
¶ 64 Leave a comment on paragraph 64 0 3.1.1 Scale data
¶ 65
Leave a comment on paragraph 65 0
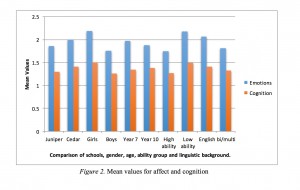
The first part of the questionnaire consisted of Likert scale items with three options to choose from. To analyse the data each option was assigned a number such that agree = 1, indifferent = 2 and disagree = 3. The data was organised and questions about ‘emotions’, ‘cognition’ and behaviour were grouped together. The data was then entered into spread sheets for statistical analysis using SPSS software. The mean scores and standard deviation for affect and cognitive components of attitude were calculated. For this data, a mean value close to 1 indicates a positive attitude whereas a higher value approaching 3 suggests a negative trend.
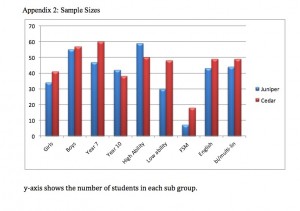
The total number of students who filled in the questionnaire was 187. Out of them 89 were from Juniper School and 98 were from Cedar School (for detail on sample sizes please see appendix 2).
¶ 66 Leave a comment on paragraph 66 0
¶ 67 Leave a comment on paragraph 67 0
¶ 68
Leave a comment on paragraph 68 0
¶ 69 Leave a comment on paragraph 69 0
¶ 70 Leave a comment on paragraph 70 0
¶ 71
Leave a comment on paragraph 71 0
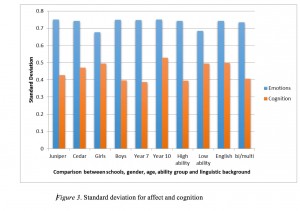
¶ 72 Leave a comment on paragraph 72 0 The data shows some difference between the affective and cognitive components of attitudes. The cognition about the usefulness of Maths for all sub groups is much more positive than affect or emotions towards Maths (Figure 2). Similarly the value for standard deviation or dispersion of data around the mean for cognition is smaller which shows limited variation in students’ opinion (Figure 3). This indicates that students understand the value of Maths even though they dislike it. Observing the sub groups, we can see that for Juniper school (low FSM), the mean values for affect (M=1.86) as well as cognition (M=1.30) are more positive as compared to Cedar School (medium FSM) with (M=2.0) and (M =1.41). In terms of gender, girls have a mean affect value of (M=2.19) which is quite high and indicate a tilt towards unfavourable emotional disposition. On the contrary, boys have a relatively positive attitude with a mean value of (M=1.76). Likewise, the cognitive component is positive for boys (M=1.26) than for girls (M=1.50). Between the two year groups, pupils of year 10 have a more positive affect (M= 1.88) as compared to year 7 (M=1.97) in contrast to data collected through focus groups; however the cognitive element of attitude for year 7 is better. Between attainment groups, we can see a sizeable difference in affect with a mean value of (M=1.75) for high ability and (M= 2.18) for low ability students. The difference in cognition is smaller though (1.27 & 1.49 respectively). Comparing the samples in terms of language, bi/multilingual students have more positive affect (M=1.81) than speakers of English only (M=2.17) however there is hardly any difference in cognition.
¶ 73 Leave a comment on paragraph 73 0 3.1.2 The t-test
¶ 74
Leave a comment on paragraph 74 2
To assess whether the difference in attitudes among the various subsets was statistically significant, two sample t-tests were carried out. The t-test is a useful statistical method that compares the actual difference between the two means in relation to the variation or spread in data expressed as standard deviation. It is a robust tool and can be used even if the number of data item in the samples is different. For this study ten t-tests were conducted to assess whether there was any significant difference in the affect and cognitive component of attitudes between:
a. Juniper School (low FSM) and Cedar school (medium FSM)
b. 11 year olds (year 7) and 15 year olds (year 10)
c. Pupils who speak English only and bi/multilingual pupils
d. Girls and boys
e. High ability and low ability pupils
¶ 75 Leave a comment on paragraph 75 0 The null hypothesis was that the means of the samples are equal and there is no significant difference between the two samples against the alternative that the means of the samples are not equal and differ significantly. The tests were conducted at the confidence interval of α = 0.05.
¶ 76 Leave a comment on paragraph 76 0 The results indicate that the mean values in the first three samples i.e. Juniper/Cedar Schools, year 7/year 10 and English/multilingual pupils are equal with a 95% confidence level. Thus there is no significant difference in affect or cognitive component of attitude between these sub groups. However, the mean values in sample (d) girls/boys and sample (e) high ability/low ability learners are not equal. This implies that we are 95% confident that the difference in the mean attitudes (affect and cognition) between girls and boys (gender) and high ability and low ability (attainment) is statistically significant.
¶ 77 Leave a comment on paragraph 77 0 3.2 Textual Data
¶ 78 Leave a comment on paragraph 78 0 The qualitative data also supports these findings and shows similar trends. However, it’s more revealing and enlightening. The high ability (HA) students (for instance, the Gifted & Talent cohort in Juniper School) exhibited a highly positive attitude towards Maths expressed as: “I love Maths”, “I enjoy Maths” and “it’s one of my favourite subjects.” These students found Maths to be “intriguing and challenging” and felt “rewarded” after tackling and understanding the tasks. They considered themselves “good at Maths” and were confident of achieving a high score in exam. They have talked about the relevance of Maths in their future education and the profession they wish to pursue. They were enthusiastic to study Maths further and believed that it was important for their future careers and also in understanding how the world works. Many of the high ability students show a high level of motivation and commitment and their attitude is positive for affect, cognition and behaviour (measured in terms of academic achievement).
¶ 79 Leave a comment on paragraph 79 0 However, a few of the high ability students commented that lessons were typically based on textbook work and lacked creativity. There was more emphasis on practising the questions and striving to score a high grade than exploring and enjoying learning. According to a Year 10 high ability boy (Y10HA – B):
¶ 80 Leave a comment on paragraph 80 2 “I feel the way Maths is imposed on school life with constant repetitive exams and teachers only teaching you what Michael Gove wants while squeezing all the enjoyment out, makes people of my age swarm away from Maths like a flock of birds” [Y10HA – B]
¶ 81 Leave a comment on paragraph 81 0 Most of the low ability students (LA) show unfavourable emotions towards Maths. They find it boring and confusing. Their aversion to Maths is related to finding the subject difficult and not being able to grasp. But they do like it “if” and “when” they understand, make progress and get good marks in exam. Affect seems to be closely related to achieving a high score in exam. Despite their aversion to Maths, they appreciate the importance of the subject.
¶ 82 Leave a comment on paragraph 82 0 The data signifies that quite a few low ability students lack confidence in their abilities and have low self-esteem for themselves. They believe that some people are naturally good at Maths. They view competence in Maths as an in born talent which cannot be acquired. It leads them to think that it’s impossible for them to progress and move to a higher grade and they feel dejected as evident in the following examples:
¶ 83 Leave a comment on paragraph 83 0 “I am never going to achieve a C or above and it’s depressing” [Y7LA – B].
¶ 84 Leave a comment on paragraph 84 0 “No matter how hard I try I cannot get the correct grade” [Y10LA – G].
¶ 85 Leave a comment on paragraph 85 0 “I dread coming to the Maths lesson as I don’t understand anything” [Y10LA – G].
¶ 86 Leave a comment on paragraph 86 0 “You need a good brain and memory for maths; something I am not good at” [Y7LA – G].
¶ 87 Leave a comment on paragraph 87 2 Girls, even in the high ability cohorts, appear to be apprehensive about the subject and are unsure of their abilities. They seem to be under a lot of pressure to perform well. The expectations from the high ability students are really high which stresses them out. Teachers expect the high ability students to understand everything quickly and “rush ahead” without ensuring whether they have grasped the topic. The pupils are reluctant to ask the teacher to explain again if they don’t understand, in order to avoid the embarrassment of being labelled “thick and dumb in set 1” [Y7HA – G]. They feel as if they are imposters in the high ability cohort although they get good grades. “I don’t think I should be in set 1… every time there is a test I wonder how I got that level” [Y7HA – G]. Boys, on the other hand are more optimistic, “I like Maths even though I am in the baddest set. I am really confident that I am going to move up sets so people don’t say you are dumb” [Y7LA – B].
¶ 88 Leave a comment on paragraph 88 0 3.3 Visual Data
¶ 89 Leave a comment on paragraph 89 0 Visual data also demonstrates a favourable ATM among high ability students and boys as seen in the following images (for details on visual data see Syyeda, 2015). The first two images (figures 4 & 5) are drawn by students from the low ability groups (a girl and a boy) and the next two images (figures 6 & 7) are drawn by higher ability boys.
¶ 90 Leave a comment on paragraph 90 0
¶ 91 Leave a comment on paragraph 91 0
¶ 92
Leave a comment on paragraph 92 0

¶ 93
Leave a comment on paragraph 93 0

¶ 94 Leave a comment on paragraph 94 0
¶ 95 Leave a comment on paragraph 95 0 Discussion
¶ 96 Leave a comment on paragraph 96 0 The findings of this research show mixed strands in attitudes towards mathematics in secondary school children in the East Midlands. A vast majority of learners have positive cognition towards the subject which indicates that they acknowledge its importance in their lives and future careers. However, a large number of students demonstrate aversion to the subject and have a negative emotional disposition towards Maths. The mean scores for cognition for all sub groups are more positive than affect with a smaller value for standard deviation. Although the components of attitudes affect (emotional disposition), cognition (belief about the importance and usefulness of the subject) and behaviour (in terms of academic achievement) are not mutually exclusive and overlap, they seem to be independent of each other. Pupils can have a combination of positive and negative attitudes at the same time. This research corroborates the findings of previous studies and shows that attitudes are strongly related to gender (e.g. Ernest, 2004; Mendick, Epstein, and Moreau, 2008) and attainment level (TIMSS, 2011). High ability learners and boys generally have positive attitudes towards Maths. However, it is not clear whether positive attitude towards Maths is the cause of high achievement, or results as an effect of high achievement. Low ability learners are desirous to learn Maths but have low self-concept which dampens their morale. They need constant motivation and reassurance to build up their confidence level. Girls, even in the high ability sets included in this research, lack faith in their capabilities and seem to be under the impact of imposter syndrome. They appear to be apprehensive about the subject and are unsure of performing well.
¶ 97 Leave a comment on paragraph 97 2 According to the quantitative analysis for this data set, ATM does not seem to be affected by the age of the learner. There is no significant difference in ATM between 11 year olds and 15 year olds. However, in focus groups, year 7 students demonstrated a more favourable attitude towards Mathematics as compared to year 10 students. Attitudes to Maths are also related to learners’ socio economic status and linguistic background as seen in the differences in mean values of affect and cognition component of attitude. Children belonging to comparatively well off families are more positive towards learning Maths. Similarly the attitudes of bi/multilingual students are positive in comparison to those who speak English only. The differences in means, however, are statistically insignificant. Nevertheless, this area needs to be further explored as this research could not include students from low ESL and low FSM schools.
¶ 98 Leave a comment on paragraph 98 0 There are many limitations which could have affected the findings of this research. It was a small scale research conducted over a period of 3 months in the summer term. Because of limited time available and difficulty in getting access to schools, the data collection tools could not be piloted as initially planned. To address this limitation, each focus group interview session was critically analysed after completion and future sessions were modified and improved so that maximum data could be extracted. However, this caused some variation in data collected earlier and later. Similarly, the questionnaire could have been improved if piloted and a couple of factual questions could have been eliminated, allowing more time for the open ended part of the questionnaire which provided rich data. Finally, this research was a case study; therefore, the findings of this research cannot be generalized.
¶ 99 Leave a comment on paragraph 99 0
¶ 100 Leave a comment on paragraph 100 0 Acknowledgement: This paper is a part of my MA (International Education) dissertation which was supervised by Dr. Phil Wood, School of Education, University of Leicester.
¶ 101 Leave a comment on paragraph 101 0
¶ 102 Leave a comment on paragraph 102 0 References
¶ 103 Leave a comment on paragraph 103 0 Adelson, J. L., & McCoach, D. B. (2011). Development and psychometric properties of the math and me survey: Measuring third through sixth graders’ attitudes towards Mathematics. Measurement and evaluation in counselling and development 44(4), 225-247. doi: 10.1177/0748175611418522.
¶ 104 Leave a comment on paragraph 104 0 Bandura, A. (1977). Self-efficacy: Toward a unifying theory of behavioural change. Psychological Review, 84, 261–271.
¶ 105 Leave a comment on paragraph 105 0 Bandura, A. (1986). Social foundations of thought and action: A social cognitive theory. Englewood Cliffs, NJ: Prentice Hall.
¶ 106 Leave a comment on paragraph 106 0 Bandura, A. (1994). Self-efficacy. In V. S. Ramachandran (Ed.), Encyclopaedia of human behaviour (4), 71–81. New York: Academic Press.
¶ 107 Leave a comment on paragraph 107 0 Bandura, A. (1997). Self-efficacy: The exercise of control. New York, NY: Freeman.
¶ 108 Leave a comment on paragraph 108 0 Berg, B. L. (2009). Qualitative research methods: for the Social Science. (7th ed). Boston: Pearson Education Inc.
¶ 109 Leave a comment on paragraph 109 0 Bloom, A. (2008). Attitudes to maths fixed by the age of 9. Retrieved August 30, 2015 from https://www.tes.com/article.aspx?storycode=6006036.
¶ 110 Leave a comment on paragraph 110 0 Bramlett, D. C., & Herron, S. (2009). A study of African – American college students’ attitude towards mathematics. Journal of Mathematical Sciences & Mathematics Education, 4(2), 43-51.
¶ 111 Leave a comment on paragraph 111 0 Bryman, A. (2012). Social research methods. New York: Oxford University Press.
¶ 112 Leave a comment on paragraph 112 0 Burns, N. & Grove, S. K. (1997). The Practice of Nursing research conduct, critique & utilization. Philadelphia: W.B. Saunders and Co.
¶ 113 Leave a comment on paragraph 113 0 Carey, M. (2011). The social work dissertation: Using small-scale qualitative methodology. New York: Open University Press.
¶ 114 Leave a comment on paragraph 114 0 Cohen, L., Manion, L. & Morrison, K. (2007). Research methods in education. (6th ed). London: Routledge.
¶ 115 Leave a comment on paragraph 115 0 Denscombe, M. (2010). The good research guide: For small-scale social research projects. (4th ed). New York: Open University Press.
¶ 116 Leave a comment on paragraph 116 0 Department for Education. Retrieved on June 10, 2014 from http://www.education.gov.uk/cgi-bin/schools/performance/group.pl?qtype=LA&no=856&superview=sec.
¶ 117 Leave a comment on paragraph 117 0 Di Martino, P., & Zan, R. (2010). ‘Me and maths’: Towards a definition of attitude grounded on students’ narratives. Journal of Mathematics Teacher Education, 13(1), 27–48.
¶ 118 Leave a comment on paragraph 118 0 Dowker, A., Bennett, K., & Smith, L. (2012). Attitudes to Mathematics in primary school children. Child Development Research. doi.org/10.1155/2012/124939.
¶ 119 Leave a comment on paragraph 119 0 Eagly, A. H., & Chaiken, S. (1998). Attitude structure and function. In D. T. Gilbert, S. T. Fiske, & G. Lindzey (Eds.), The Handbook of Social Psychology (4th ed). 269–322. New York: McGraw-Hill Fellows, M.M.
¶ 120 Leave a comment on paragraph 120 0 Ernest, P. (2004). Images of Mathematics, values and gender. In S. Johnston-Wilder, & B. Allen (Eds.), Mathematics education: Exploring the culture of learning. Routledge.
¶ 121 Leave a comment on paragraph 121 0 Fennema, E. & Sherman, J. A. (1976). Fenemma-Sherman Mathematics Attitude Scales: Instruments designed to measure attitudes towards the learning of mathematics by females and males. Journal for research in Mathematics Education, 7(5), 324-326.
¶ 122 Leave a comment on paragraph 122 0 Fishbein, M., & Ajzen, I. (1975). Belief, attitude, intention and behaviour: An introduction to theory and research. Reading, MA: Addison – Wesley.
¶ 123 Leave a comment on paragraph 123 0 Henderson, N.R. (1995). A practical approach to analysing and reporting focus groups studies: Lessons from qualitative market research. Qualitative Health Research 5, 463-477.
¶ 124 Leave a comment on paragraph 124 0 Ireson, J, Hallam, S. & Plewis, I. (2001). Ability grouping in secondary schools: Effects on pupils’ self-concepts. British Journal of Educational Psychology, 71(2), 315–326.
¶ 125 Leave a comment on paragraph 125 0 Kitzinger, J. (1995). Introducing Focus Groups. British Medical Journal, 311, 299 – 302.
¶ 126 Leave a comment on paragraph 126 0 Klinger, C. M. (2004). Study skills and the Math-anxious: reflecting on effective academic support in challenging times. In K. Dellar-Evans, & P. Zeegers (Eds.), Language and Academic Skills in Higher Education, (Vol 6); Refereed proceedings of the 2003 Biannual Language and Academic Skills Conference 161–171. Adelaide: Flinders University Press.
¶ 127 Leave a comment on paragraph 127 0 Ma, X., & Kishor, N. (1997). Assessing the relationship between attitude towards Mathematics and achievement in Mathematics: A meta-analysis. Journal for Research in Mathematics Education, 28(1), 27- 47. doi.org/10.2307/749662.
¶ 128 Leave a comment on paragraph 128 0 Mendick, H , Epstein, D and Moreau, M.P. (2008). Mathematical images and identities: entertainment, education, social justice. Research in Mathematics Education, 10(1), pp. 101-102.
¶ 129 Leave a comment on paragraph 129 0 Meyer, D. K., Turner, J. C., & Spencer, C. A. (1997). Challenge in a classroom: Students’ motivation and strategies in project-based learning. Elementary School Journal, 97, 501–521.
¶ 130 Leave a comment on paragraph 130 0 Meyer, M. R., & Koehler, M. S. (1990). Internal influences on gender differences in Mathematics. In E. Fennema & G. C. Leder (Eds), Mathematics and Gender 60–95, New York, NY: Teachers College Press.
¶ 131 Leave a comment on paragraph 131 0 National Numeracy (2012) retrieved August 12, 2014 from http://www.nationalnumeracy.org.uk/what-issue.
¶ 132 Leave a comment on paragraph 132 0 Neuman, W. L. (2005). Social Research Methods. Qualitative and Quantitative approaches (6thed.). Boston: Allyn and Bacon.
¶ 133 Leave a comment on paragraph 133 0 Nicolaidou, M., & Philippou, G. (2003). Attitudes towards Mathematics, self-efficacy and achievement in problem solving. European Research in Mathematics, III. Retrieved June 1, 2014 from http://www.dm.unipi.it/~didattica/CERME3/proceedings/Groups/TG2/TG2_nic olaidou_cerme3.pdf.
¶ 134 Leave a comment on paragraph 134 0 OECD (2013). PISA 2012 Results: Ready to learn – Students’ engagement, drive and self- beliefs (Volume III), PISA, OECD Publishing. doi:10.1787/9789264201170-en
¶ 135 Leave a comment on paragraph 135 0 Oxford Dictionary (2016) retrieved April 10, 2016 from http://www.oxforddictionaries.com/definition/english/attitude.
¶ 136 Leave a comment on paragraph 136 0 Pajares, F., & Miller, D. (1994). Role of self-efficacy and self-concept beliefs in Mathematical problem solving: A path analysis. Journal of Educational Psychology, 86, 193–203.
¶ 137 Leave a comment on paragraph 137 0 Papanastasiou, C. (2000). Effects of attitudes and beliefs on Mathematics achievement. Studies in Educational Evaluation, 26, 27-42. doi.org/10.1016/S0191-491X(00)00004
¶ 138 Leave a comment on paragraph 138 0 Patton, M. Q. (2002). Qualitative evaluation and research methods (3rd ed). Thousand Oaks, CA: Sage Publications, Inc.
¶ 139 Leave a comment on paragraph 139 0 Pintrich, P. R., & Zusho, A. (2002). The development of academic self-regulation: The role of cognitive and motivational factors. In A.Wigfield, & J. S. Eccles (Eds.), Development of achievement motivation. 249–284, San Diego, CA: Academic Press.
¶ 140 Leave a comment on paragraph 140 0 Renninger, K. A., & Hidi, S. (2002). Student interest and achievement: Developmental issues raised by a case study. In A. Wigfield, & J. S. Eccles (Eds.), Development of achievement motivation. 173–195, San Diego, CA: Academic Press.
¶ 141 Leave a comment on paragraph 141 0 Rogers, L. (2003). Gender differences in approaches to studying for GCSE among Year 10 pupils. The Psychology of Education Review 27, 18–27.
¶ 142 Leave a comment on paragraph 142 0 Rubinstein, M. F. (1986). Tools for thinking and problem solving. New Jersey: Prentice Hall.
¶ 143 Leave a comment on paragraph 143 0 Sim, J. and Snell, J. (1996). Focus groups in physiotherapy evaluation and research. Physiotherapy 82, 189 – 197.
¶ 144 Leave a comment on paragraph 144 0 Smith, C. (2011). Proceedings of the British Society for Research into Learning Mathematics (Ed.) 31(1).
¶ 145 Leave a comment on paragraph 145 0 Stipek, D. (2002). Good instruction is motivating. In Wigfield, A & Eccles, J. S. (Eds.), Development of achievement motivation. 309–332, San Diego, CA: Academic Press.
¶ 146 Leave a comment on paragraph 146 0 Sun, H. (2009). Investigating feelings towards mathematics among Chinese kindergarten children. Thirty-second annual conference of the mathematics education research group of Australia, 5-9 July 2009, Wellington, New Zealand. Retrieved June 6, 2014 from http://eprints.qut.edu.au/26654/2/26654.pdf.
¶ 147 Leave a comment on paragraph 147 0 Syyeda, F. (2015). A Picture is Worth a Thousand Words: Examining learners’ illustrations to understand attitudes towards Mathematics. Exchanges: the Warwick Research Journal, (Vol 2), No 2. Retrieved May 15, 2015 from http://exchanges.warwick.ac.uk/index.php/exchanges/article/view/61.
¶ 148 Leave a comment on paragraph 148 0 Thurstone, L.L. (1928). Implicit attitudes can be measured. Retrieved June 1, 2014 from http://www.fas.harvard.edu/~mrbworks/articles/2001_Banaji_HLRoediger.pdf. TIMSS (2011) retrieved July 1, 2014 from http://timss.bc.edu/timss2011.
¶ 149 Leave a comment on paragraph 149 0 Warren, H. and Paxton, W. (2013) Too Young to Fail. Save the Children. Retrieved January 8, 2016 from http://www.savethechildren.org.uk/2013-10/poor-children%E2%80%99s-life-chances-determined-age-seven-%E2%80%93-save-children.
¶ 150 Leave a comment on paragraph 150 0 Appendix 1: Themes from Focus group data
¶ 151
Leave a comment on paragraph 151 0
¶ 152 Leave a comment on paragraph 152 0
¶ 153 Leave a comment on paragraph 153 0
¶ 154 Leave a comment on paragraph 154 0
¶ 155 Leave a comment on paragraph 155 0 Appendix 2: Sample Sizes

Comments
3540 Comments on the whole Page